SincpacC3D
General Information
Command Summary

DisplayPoints
|
SincpacC3D
General Information
Command Summary
DisplayPoints |
Description
The DisplayPoints command displays selected points in a grid, including Station and Offset, with options for editing points, adding/removing them from Point Groups, and printing them to delimited output files (CSV, tab-delimited, etc.) or directly to a printer. Also includes the ability to display a Surface elevation at each point, as well as a Cut/Fill between the Cogo Points and Profile/Surface.
Usage
Type DisplayPoints at the command line. Or select some points, then right-click and select "Display Points" from the shortcut menu. You will then see a dialog box like that below:
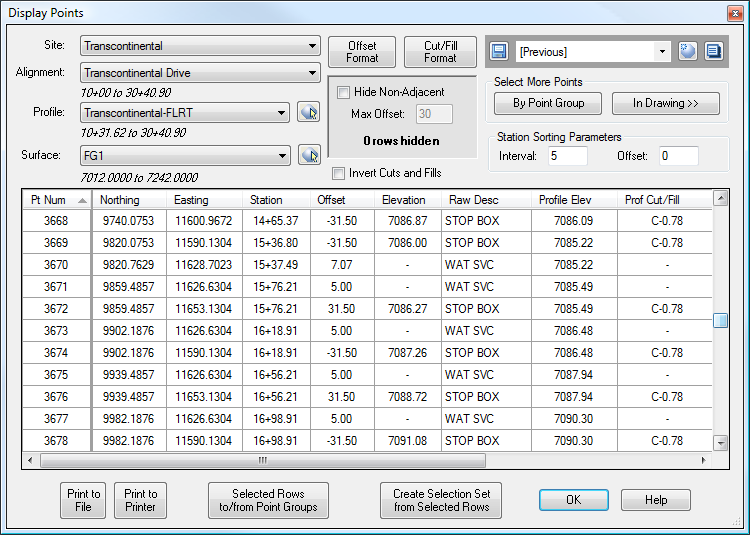
The individual columns in the grid may be dragged into any order, except for the Point Number column, which always remains visible at the left side of the grid. Click on a column header to sort the grid by that column. Columns may be sorted in either forward or reverse order. You may also right-click on the grid, and hide or unhide various columns. In the diagram below, the display is set to show a restricted set of options, and the columns have been re-arranged so that all three elevations are side-by-side:
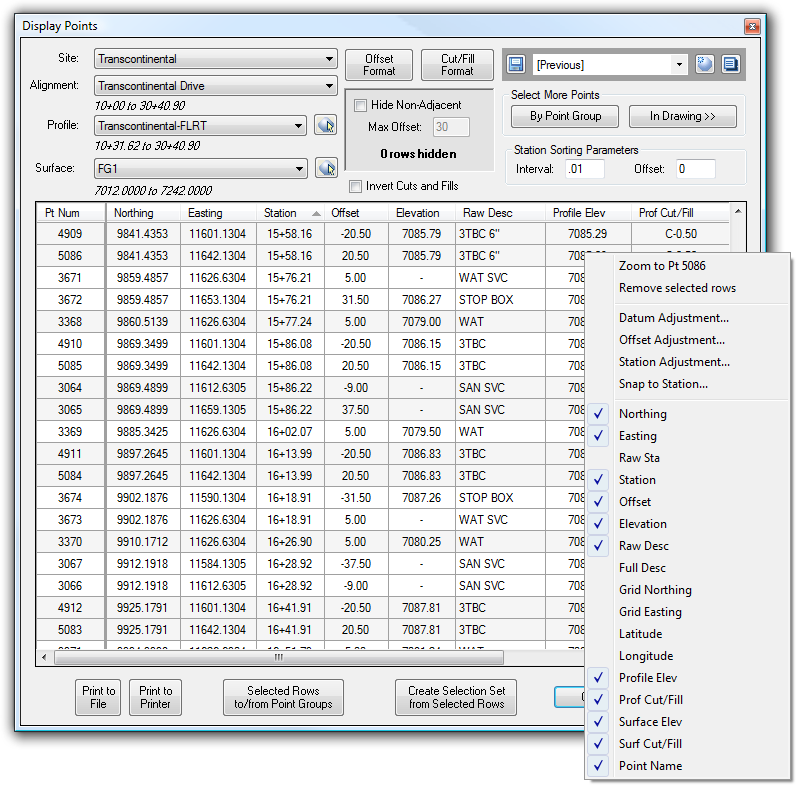
Zoom feature: Note that you can right-click on any row, and zoom directly to that point in the drawing. This is designed to allow you to take a "quick look" at that Cogo Point. Click a mouse button, or hit ENTER or ESC on the keyboard, and you will return to the grid view.
You may add more points to the list using the two "Select More Points" buttons in the upper-right, or you may remove points from the list by selecting one or more cells in the row(s) you wish to delete, then right-clicking and selecting "Remove selected rows" from the shortcut menu. After selecting items in the display grid, you may also Copy and Paste them into Microsoft Excel or similar programs. Or click the "Selected Rows to/from Point Groups" to add and/or remove selected Cogo Points from Point Groups. You may also double-click on a row to edit the point, or right-click on certain columns to edit that value for all selected rows at once.
In order to make it possible to Copy and Paste individual cells or groups of cells into Excel, it is possible to select individual cells in the grid. Any command that works on a row (such as the "Selected Rows to/from Point Groups" button) will operate on any row that has at least one cell selected in it.
If the current drawing contains Alignments (with or without Profiles), an Alignment or Profile may be selected in the upper-left of the dialog box. The Station and Offset values displayed in the table are calculated using this Alignment. Select a different Alignment in the combo box (or click on the small button to pick an Alignment in the drawing), and the Station and Offset values displayed in the table will be recalculated based on the selected Alignment. If a Profile is selected and the Cogo Point is adjacent to the Profile, the Profile Elevation at each point will appear in the grid.
Similarly, if there are any Surfaces in the drawing, a Surface may be selected in the upper-left, and the Surface Elevation at each point will appear in the grid.
The Quickset Panel and the Display
The Quickset Panel in the upper-right can be used to save your favorite display layouts. Note that all columns in the grid (except for Point Number, which is frozen to the left edge) can be dragged into different orders and resized, and the table can be sorted by any column, by either increasing or decreasing values. In the image above, the display is sorted by increasing Station (note the small triangle in the column header).
You may arrange and resize the columns however you wish, and then save these settings in a Quickset. You may then recall these settings instantly from the Quickset. The Quickset remembers only the display layout of the grid view, so changing the Quickset will only affect the layout of items in the grid. It will not affect any other options in this dialog box.
Grid Sorting
The grid may be sorted on any column. The Raw Description is used when sorting by station, even if you select the Station column, so the station list will always sort correctly when sorted by Station, even when Station Equations are used. In addition, secondary sort columns are used in some cases. For example, when sorting by Description, if two rows have the same Description, they are then sorted by Point Number. If points are sorted by Station, then two points at the same Station are then sorted by Offset. In addition, the Station Sorting Parameters provide additional control over sorting.
Offset Format
The format of the offset may be adjusted by clicking the "Offset Format" button. For example, you may configure the offsets to display as "=34" or "34L" or "-34LT" or "34Lt", etc.
Cut/Fill Format
The format of the Cut/Fill columns may be adjusted by clicking the "Cut/Fill Format" button.
Hide Non-Adjacent
When this option is selected, points that are further than the Max Offset from the Alignment will hidden from the display grid. When rows are hidden, the count of hidden rows will appear in this box. Rows that are hidden are not included when the "Print to File" or "Print to Printer" buttons are used. A row is considered to be "selected" if any cell in that row is selected.
Invert Cuts and Fills
Normally, Cuts and Fills are calculated using the Surface or Profile as the target grade. When this option is selected, Cuts and Fills are calculated using the Cogo Point as the target grade.
Print to File
Click on the "Print to File" button to save the current display to a delimited text file, such as a CSV file. Items are output to the file in the same order as the column display order on the screen, so you may drag the columns to a different display order to change the way the CSV file is generated. Also, if a column is hidden in the grid view, it will not be sent to the output file.
Click on the "Print to File" button to call up the following screen:
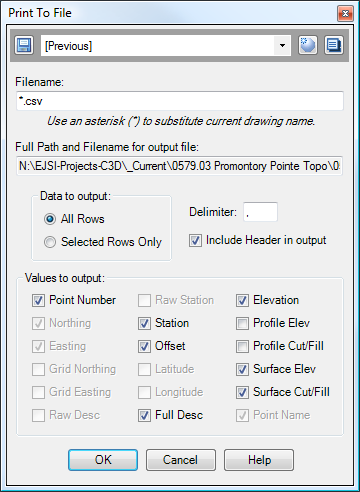
The text file is created in the same directory as the DWG file, unless you explicitly specify a relative or full path in the Filename dialog box. If the Filename contains an asterisk (*), the asterisk will be replaced with the current drawing name.
The rest of the dialog box contains various options for the output. If you wish to create a tab-delimited file, use "\t" for the Delimiter. These settings may be saved in a Quickset, using the Quickset Panel at the top of the dialog box.
In addition, there are options for each of the columns in the display, in case you do not wish to send all the values to the file. For example, you may display the Raw Description in the dialog box, but uncheck it on this screen, to keep the Raw Description from being sent to the output file. Any value that is hidden in the grid will not show up in the output file, and the corresponding checkbox on this screen will be greyed-out to indicate that the value is hidden in the grid.
Print to Printer
Click on the "Print to Printer" button to print the current display on the default printer. This is a "quick-print" functionality, designed to quickly send data to the printer. If you need greater control over the print, then use the "Print to File" option to send the data to a file, and edit the file in Excel. (Or select items in the Data Grid View, and copy-and-paste them into Excel.)
You may print the entire contents of the Data Grid View to the printer, or you may print only selected items. As with the "Print to File" option, items are sent to the printer in the same order as they appear in the display, and hidden rows and columns are not sent to the printer.
Selected Rows to/from Point Groups
This button calls the PGAddRemovePoints command, using points that are selected in the display grid. Note that only the Points that are selected in the grid view will be added/removed to/from the Point Groups. You may use CTRL-A to select all rows in the grid view.
Create Selection Set from Selected Rows
This button creates a selection set from the points that are selected in the display grid. It then closes the dialog box, terminating the DisplayPoints command. The selected Cogo Points will be in the active selection set, and available for the next command. Note that only the Points that are selected in the grid view will be added/removed to/from the Point Groups. You may use CTRL-A to select all rows in the grid view.
Editing Points
Double-click on any row to edit the Point. After double-clicking on the row, a dialog box similar to this one will appear:
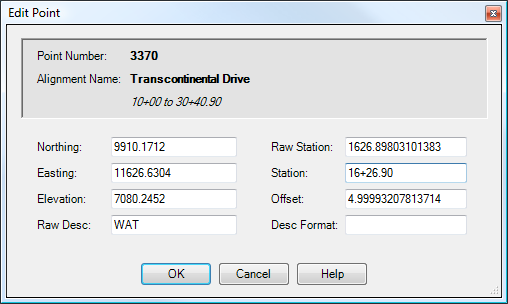
Note that you may edit the Northing and Easting, and the Station and Offset will change accordingly. Or, you may edit the Station and Offset, and see the Northing and Easting change accordingly. You may also edit a few other properties of the Point, namely the Point Elevation, Raw Description, and Description Format string. You may use a "." or a "-" for the Point Elevation to indicate "No Elevation".
The value for Station (below the Raw Station) will honor any station equations that may exist in the alignment. If you key in a new value for the Station, and that station exists in multiple locations in the alignment (due to station equations), you will be asked to select the desired occurrence by picking a point in the drawing.
You may also edit a value for multiple points simultaneously by selecting multiple points (by selecting one or more cells in that row), then right-clicking on the column you wish to edit. The new value you enter is applied to all selected points.
In the image below, multiple rows are selected, and the Offset for all selected points could be changed by right-clicking and selecting "Edit Offset..." from the context menu:
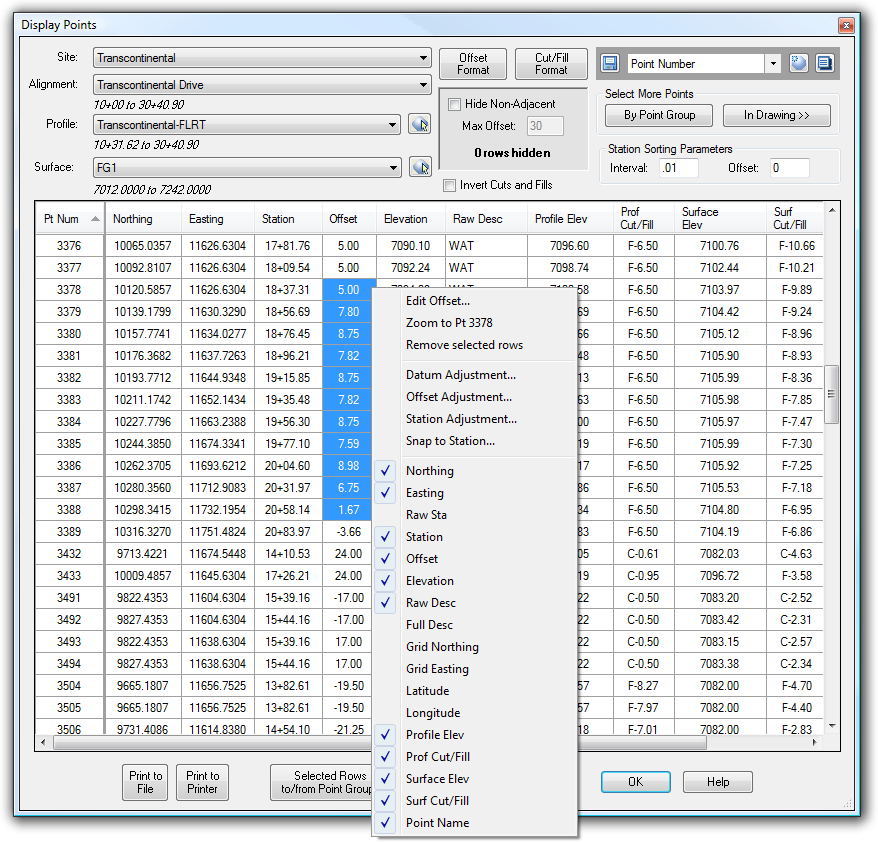
Note that not all columns can be edited. If the column cannot be edited, no "Edit..." option will appear in the context menu.
Similarly, you may also use the "Datum Adjustment...", "Offset Adjustment...", or "Station Adjustment..." options to add a specified value to the Elevation, Offset, or Station of all selected points.
Snap to Station
The "Snap to Station..." option may be used to move Cogo Points to the closest Alignment station, as specified by the "Station Snap" settings. To use this feature, select the Cogo Points you wish to change, then right-click and select "Snap to Station...". You will then see the following dialog box
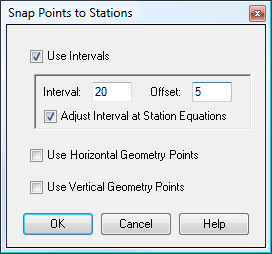
This dialog box allows you to specify the allowable stations. Selected Cogo Points get snapped to the closest allowed station. The allowed stations may be a set interval, or they may be horizontal or vertical geometry points from the Alignment and Profile selected on the main grid.
When specifying the Interval, an offset may also be used to gain further control over the interval. For example, the settings in the dialog box shown above are for an interval of 20, and an offset of 5. This results in allowed stations of 0+05, 0+25, 0+45, etc.
If the option for "Adjust Interval at Station Equations" is selected, then the interval is adjusted at Station Equations. For example, the following table illustrates the allowed station, using settings with Interval = 25 and Offset = 0, and the Alignment has a station equation where Sta 0+90 = 1+00:
Adjust at Station Equations |
No Adjustment |
0+00 |
0+00 |
0+25 |
0+25 |
0+50 |
0+50 |
0+75 |
0+75 |
1+00 |
1+10 |
1+25 |
1+35 |
1+50 |
1+60 |
Note that, since the Alignment has a station equation where Sta 0+90 = 1+00, there is only 15' of raw station between Station 0+75 and Station 1+00. If we select the option to adjust the interval at station equations, we get the first column, where our allowed stations stay on the even intervals. If we do not adjust the interval at station equations, we end up with the second column, where there is 25' of raw station between every allowed station.
See Also
Analyzes the distortion between grid and ground distances, using either Cogo Points or an existing ground surface in the current drawing.
Displays geometry and interval points along an alignment and profile, and can print the output to delimited output files (CSV, tab-delimited, etc.) or directly to a printer. May also be used to generate Cogo Points along Alignments, or display a Surface elevation at each station, along with a Cut/Fill between the Surface and Profile at each Station.
Manages dynamic links between Cogo Points and other Civil-3D entities. This allows the elevations of Cogo Points to change dynamically whenever the "master" object changes. Similarly, the description may be set to display the Station/Offset of the point, and the Station/Offset will also dynamically respond to changes in the model. The "master" object may be a Surface, a Profile, an Alignment, or a linear entity such as a Feature Line, Survey Figure, Polyline, or 3D-Polyline.
Displays information about items underneath the cursor.
Add and/or remove selected Civil-3D Points to/from one or more existing Point Groups.
Select Cogo Points and Linework (Polylines or Parcels), and see the distance and direction to each Cogo Point from the nearest linework vertex.
Display Points by Station and Offset, as measured along an Alignment. Results are displayed in the command window and may also be written to a file.
Key in a station on one alignment, and see the station/offset of that point as measured along another alignment.
Adds Station and Offset to the description of selected points.
