SincpacC3D
General Information
Command Summary

LotFit
|
SincpacC3D
General Information
Command Summary
LotFit |
Description
The LotFit command may be used to select Cogo Points and Linework (Polylines or Parcels), and see the distance and direction to each Cogo Point from the nearest linework vertex.
Usage
Analyzes the distortion between grid and ground distances, using either Cogo Points or an existing ground surface in the current drawing.
You may select Cogo Points and Linework prior to running the command, or you may simply initiate the command by typing LotFit at the command line.
Linework may be Polylines, Lines, Feature Lines, Survey Figures, or Parcels. When selecting individual Parcels, select the primary Parcel Area Label. You may also select a Site in the dialog box. Cogo Points may be selected either by Point Group, or individually in the drawing.
The result is a display similar to the one below:
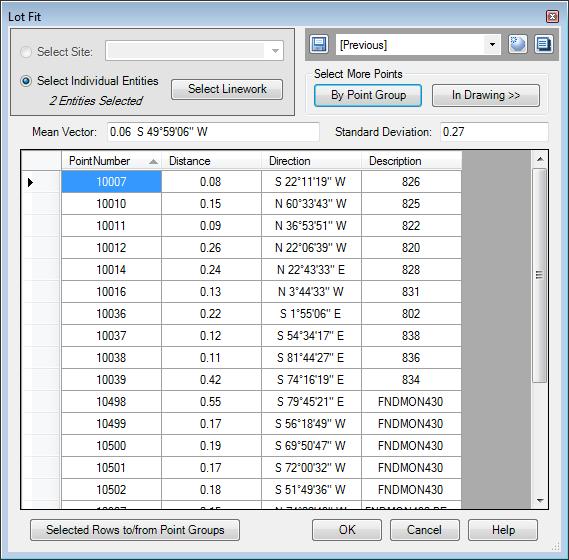
Distance and direction are calculated from the linework to the Cogo Point. You may right-click on a Cogo Point to zoom to the point in the drawing. At this point, you may also zoom and pan around in the drawing, and a tooltip will appear next to the cursor, showing distance and direction for the Cogo Point nearest the cursor.
The dialog box also displays the mean of all the displacements vectors in the table, as well as the standard deviation of all the displacement distances.
The "Selected Rows To/From Point Groups" button calls up the PGAddRemovePoints command, using points that are selected in the display grid. Note that only the Points that are selected in the grid view will be added/removed to/from the Point Groups. You may use CTRL-A to select all rows in the grid view.
See Also
Displays geometry and interval points along an alignment and profile, and can print the output to delimited output files (CSV, tab-delimited, etc.) or directly to a printer. May also be used to generate Cogo Points along Alignments, or display a Surface elevation at each station, along with a Cut/Fill between the Surface and Profile at each Station.
A Cogo Point browser, editor, and reporting tool, all rolled into one. Displays selected points in a grid, including Station and Offset, with options for editing points, adding/removing them from Point Groups, and printing them to delimited output files (CSV, tab-delimited, etc.) or directly to a printer. Also includes the ability to display a Surface elevation at each point, as well as a Cut/Fill between the Cogo Points and Profile/Surface.
Manages dynamic links between Cogo Points and other Civil-3D entities. This allows the elevations of Cogo Points to change dynamically whenever the "master" object changes. Similarly, the description may be set to display the Station/Offset of the point, and the Station/Offset will also dynamically respond to changes in the model. The "master" object may be a Surface, a Profile, an Alignment, or a linear entity such as a Feature Line, Survey Figure, Polyline, or 3D-Polyline.
