SincpacC3D
General Information
Command Summary

AnalyzeDistortion
|
SincpacC3D
General Information
Command Summary
AnalyzeDistortion |
Description
The AnalyzeDistortion command analyzes the distortion between grid and ground distances, using either Cogo Points or an existing ground surface in the current drawing.
This routine can only be used when a Coordinate Zone is selected in the Drawing Settings.
Usage
Type AnalyzeDistortion at the command line. You will then see a dialog box like the following:
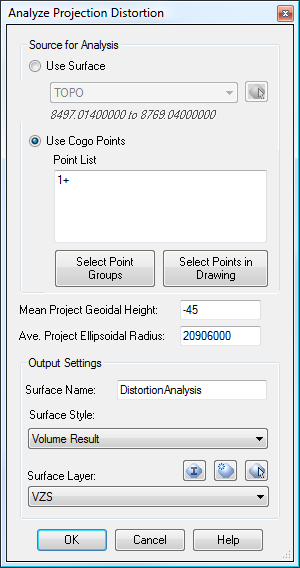
Source for Analysis
In this section, select the data to use for the analysis. This data may be a TIN surface (usually an Existing Ground surface), or a selection of Cogo Points. When selecting Cogo Points, you may edit the Point List manually, or use the buttons to add more points to the list. NOTE: You may want to erase the existing Point List before using "Select Point Groups" or "Select Points in Drawing", since these options will add the selected Cogo Points to the existing list.
Mean Project Geoidal Height
In this field, enter the average height of the geoid over your project area, or set the value to 0 to ignore the geoidal separation for the analysis.
Average Project Ellipsoidal Radius
The Ellipsoidal Radius to use for the analysis. This value should be the radius of the Earth at your project location. For most areas in the continental United States, the default values of 20,906,000 feet or 6,372,000 meters is usually sufficient.
Output Settings
In this section, specify the Name, Style, and Layer for the Analysis surface. This surface is a TIN surface, so Elevation banding displays may be used. The Z-value for each point in the surface is the distortion in parts-per-million for that point.
Example
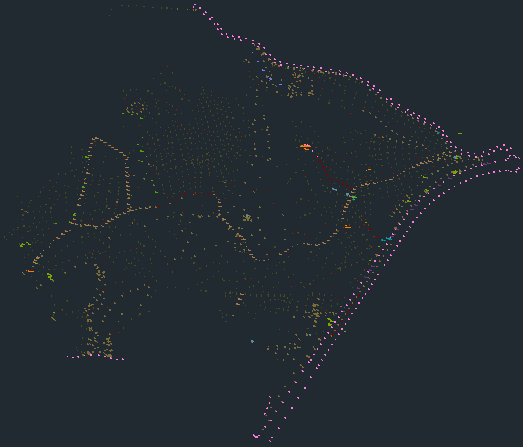
The image below shows a drawing that is set to a custom coordinate system, with field shots imported as Cogo Points.
We then run the AnalyzeDistortion command, and see a dialog box like the one shown below:

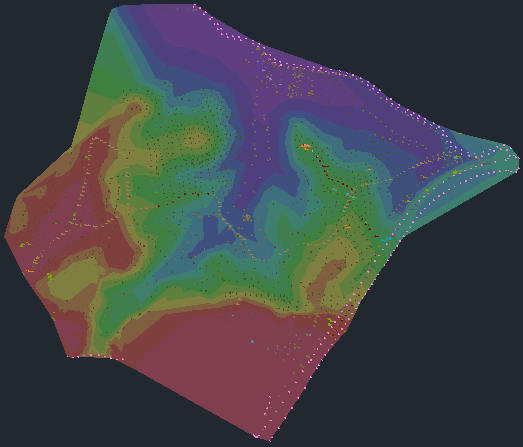
We'll leave the "Source for Analysis" set to use all Cogo Points in the drawing. We've also entered the average geoidal height for our project, as well as the Ellipsoidal Radius to use in our analysis. The result (in Parts Per Million) ends up in a Surface. By setting the Surface Style to one with an Elevation display turned on, we see the result in following image:
We can also add a custom Elevation Table that displays the minimum and maximum values for each color band, as seen below:
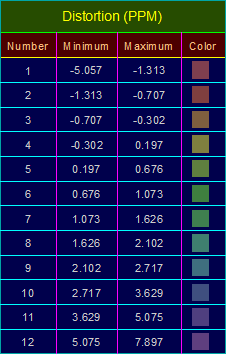
The table above shows that the grid distortion on our site ranges from approximately -5 PPM to almost +8 PPM. This means that over 1000 feet, the grid distance is about 0.005' shorter than ground in the red areas, and about 0.008' longer than ground in the purple areas. In other words, our grid-to-ground distortion is less than our survey field error, and can be completely ignored over this entire site.
See Also
Displays geometry and interval points along an alignment and profile, and can print the output to delimited output files (CSV, tab-delimited, etc.) or directly to a printer. May also be used to generate Cogo Points along Alignments, or display a Surface elevation at each station, along with a Cut/Fill between the Surface and Profile at each Station.
A Cogo Point browser, editor, and reporting tool, all rolled into one. Displays selected points in a grid, including Station and Offset, with options for editing points, adding/removing them from Point Groups, and printing them to delimited output files (CSV, tab-delimited, etc.) or directly to a printer. Also includes the ability to display a Surface elevation at each point, as well as a Cut/Fill between the Cogo Points and Profile/Surface.
Select Cogo Points and Linework (Polylines or Parcels), and see the distance and direction to each Cogo Point from the nearest linework vertex.
