SincpacC3D
General Information
Command Summary

DisplayAlignProf (DisplayProfile)
|
SincpacC3D
General Information
Command Summary
DisplayAlignProf (DisplayProfile) |
Description
The DisplayAlignProf command (formerly the DisplayProfile command) displays geometry and interval points along an Alignment and Profile, and can print the output to delimited output files (CSV, tab-delimited, etc.) or directly to a printer.
Usage
Type DisplayAlignProf (or DisplayProfile) at the command line. Alternatively, select an Alignment or Profile on-screen, then right-click and select "Display Align/Prof" (or "Display Profile") from the shortcut menu. You will then see a dialog box like that below:
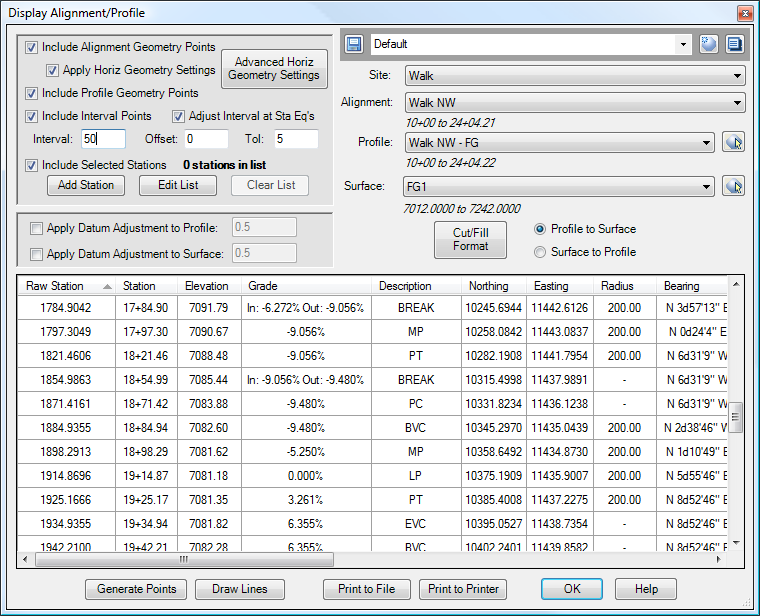
An Alignment or Profile may be selected in the upper-right of the dialog box, and the data for the selected Alignment/Profile will be shown in the display. Similarly, a Surface may be selected, and the Surface elevation at each Station will appear in the display. Note that you may select cells in the display grid (you can also hold down CTRL or SHIFT to select multiple cells), then Copy and Paste the selection into Microsoft Excel or similar programs.
The columns in the display include the following:
The Quickset Panel and the Display
The Quickset Panel in the upper-right can be used to save your favorite display layouts. Note that all columns in the grid can be dragged into different orders and resized, and the table can be sorted by any column, by either increasing or decreasing values. In the image above, the display is sorted by increasing Raw Station (note the small triangle in the column header).
In addition to dragging the columns into a different order, it is possible to hide and unhide various columns by right-clicking in the grid view.
Zoom Feature
Note that it is possible to right-click on any row, and select "Zoom to..." to zoom directly to that station in the drawing. This is designed to allow you to take a "quick look" at that portion of the alignment. Click a mouse button, or hit ENTER or ESC on the keyboard, and you will return to the grid view.
Geometry Selection
The upper-left corner contains a set of controls that determine which types of geometry points appear in the list. You may select between the Alignment geometry points (PI, PC, PT, Spiral points, etc.), Profile geometry points (BVC, EVC, Grade Break, etc.), and points set at even intervals. The Offset can be used to shift the interval stations. For example, an interval of 25 and an offset of 10 would cause points to be generated at stations 0+10, 0+35, 0+60, 0+85, etc.
The Tolerance value causes interval points to be suppressed if there is already a geometry point within the specified distance. For example, assume the Interval is set to 25, and the Tolerance (Tol) is set to 5. If there is a PC at station 2+47.45, then no interval point will be created at station 2+50, because there is already a point within 5 feet of station 2+50.
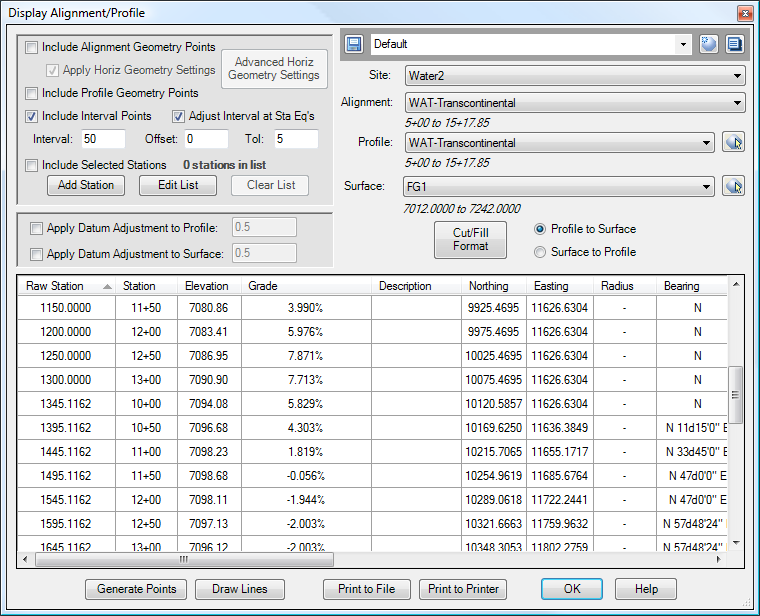
The checkbox for "Adjust Interval at Sta Eqs" may be used to adjust the interval at Station Equations. In the image below, only the Interval points are displayed in the grid, and this option is NOT selected. Note how the entries in the grid are always 50 feet apart, even in the area around the Station Equation:
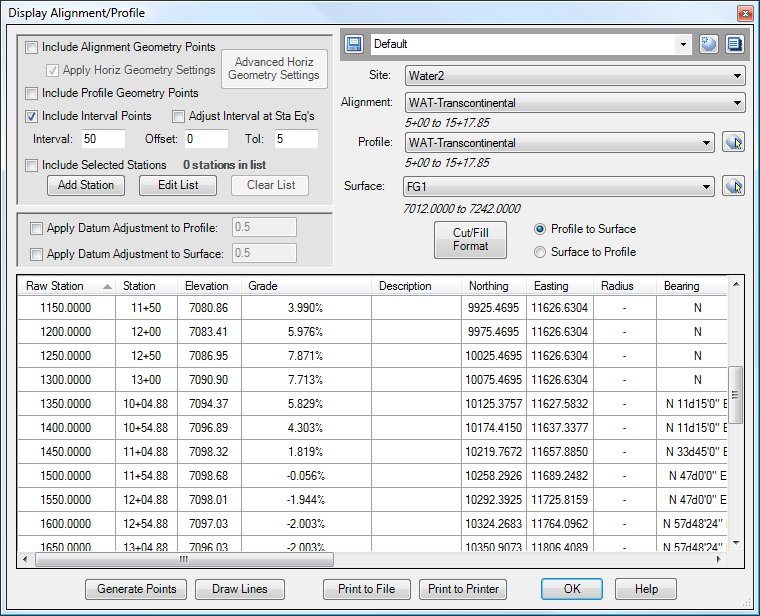
In the image below, the "Adjust Interval at Sta Eqs" option has been turned ON. Note how now the Station String is always at an even multiple of 50 feet, even in the area around the Station Equation:
Include Selected Stations
In addition to the horizontal and vertical geometry points, you may add individually-selected stations at any point of interest by adding stations to the "Include Selected Stations" list. Each Alignment has its own list of additional stations. Add additional stations by clicking the "Add Station" button", or by clicking the "Edit List" button. The "Edit List" button will display a dialog box like the following:
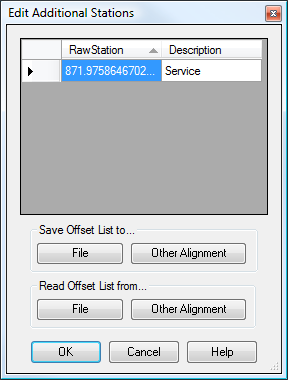
Right-click to add additional stations by either picking points in the drawing or by keying in a station, or select stations and hit the "Delete" key to remove them from the list. You may also use the buttons in the lower part of the dialog box to copy stations to/from other Alignments, or to/from a file. The format for each line of a user created file to import must be Station,Description Be sure to include the comma even when no description is desired.
Apply Datum Adjustment
The Datum Adjustment option may be used to apply a specified vertical offset to each point along the Profile. In order to call attention to the fact that a Datum Adjustment is being applied, the background for the Elevation column will turn a light salmon color when the "Apply Datum Adjustment" option is selected. The image below shows the same Profile as the first image above, except now a Datum Adjustment of 0.50 is being applied. (In addition, the columns have been re-arranged into a slightly different display.)
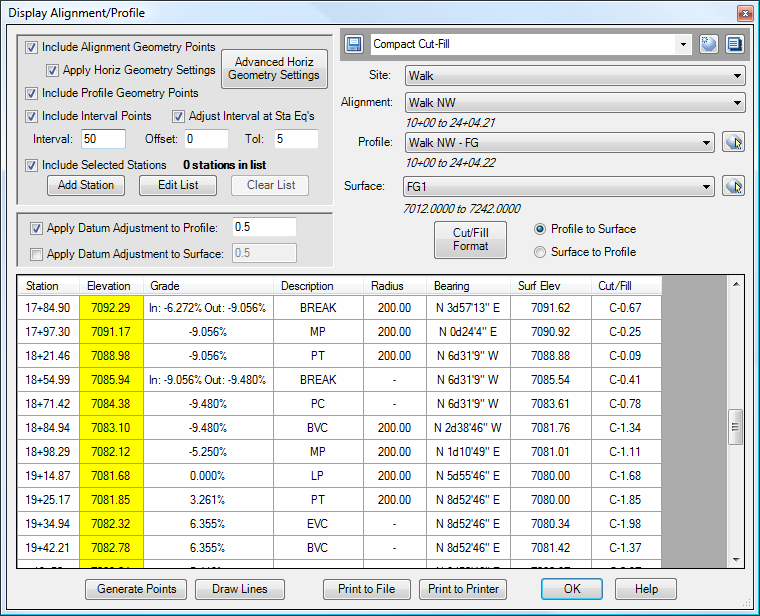
Cut/Fill Format
The format of the Cut/Fill columns may be adjusted by clicking the "Cut/Fill Format" button. Additionally, the direction of the Cut/Fill may be specified by clicking on the "Profile to Surface" and "Surface to Profile" radio buttons.
Generate Points
Click on the "Generate Cogo Points" button to generate Cogo Points along the Alignment. Points are generated at each station shown in the grid, so configure the grid display options before clicking on this button. To generate Cogo Points along only a portion of the Alignment, select the desired rows in the grid before clicking on this button.
Draw Lines
Click on the "Draw Lines" button to draw lines perpendicular to the Alignment. Lines are drawn at each station shown in the grid, so configure the grid display options before clicking on this button. To draw lines along only a portion of the Alignment, select the desired rows in the grid before clicking on this button. (Users of the original Sincpac for Land Desktop may recognize this as the old NOTCH command.)
Print to File
Click on the "Print to File" button to save the current display to a delimited text file, such as a CSV file. Items are output to the file in the same order as the column display order on the screen, so you may drag the columns to a different display order to change the way the CSV file is generated. You may also select which columns you want to output to the text file. When you hit the "Print to File" button, you will see the following screen:
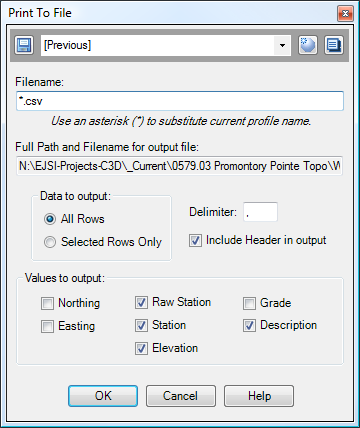
The file is created in the same directory as the DWG file. You may also specify a relative or full path in the Filename dialog box. If the Filename contains an asterisk (*), the asterisk will be replaced with the Profile name.
The rest of the dialog box contains various options for the output. If you wish to create a tab-delimited file, use "\t" for the Delimiter. These settings may be saved in a Quickset, using the Quickset Panel at the top of the dialog box.
Print to Printer
Click on the "Print to Printer" button to print the current display on the default printer. This is a "quick-print" functionality, designed to quickly send data to the printer. If you need greater control over the print, then use the "Print to File" option to send the data to a file, and edit the file in Excel. (Or select items in the Data Grid View, and copy-and-paste them into Excel.)
You may print the entire contents of the Data Grid View to the printer, or you may print only selected items.
See Also
A Cogo Point browser, editor, and reporting tool, all rolled into one. Displays selected points in a grid, including Station and Offset, with options for editing points, adding/removing them from Point Groups, and printing them to delimited output files (CSV, tab-delimited, etc.) or directly to a printer. Also includes the ability to display a Surface elevation at each point, as well as a Cut/Fill between the Cogo Points and Profile/Surface.
Displays information about items underneath the cursor.
Select Cogo Points and Linework (Polylines or Parcels), and see the distance and direction to each Cogo Point from the nearest linework vertex.
Display Points by Station and Offset, as measured along an Alignment. Results are displayed in the command window and may also be written to a file.
Key in a station on one alignment, and see the station/offset of that point as measured along another alignment.
Adds Station and Offset to the description of selected points.
